Genre: eLearning | MP4 | Video: h264, 1280×720 | Audio: aac, 48000 Hz
Language: English | SRT | Size: 3.58 GB | Duration: 6h 18m
What you’ll learn
Linux Kernel Debugging Techniques
Requirements
Should have knowledge in Linux Kernel
Description
A traditional debugger allows you to inspect the system state once the system is halted
i.e., after an error has been detected, but doesn’t reveal the events leading to the error.
To understand why an event took place, the relevant context has to be restored. This requires tracing
Tracing is the process of collecting information on the activity in a working system
With tracing, program execution is recorded during run-time, allowing for later analysis of the trace
Tracing provides developers with information useful for debugging.
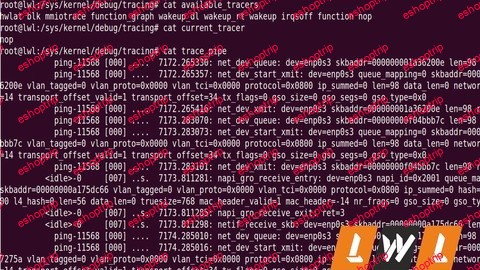
In this course, we will be learning ftrace, which is the official tracer of Linux Kernel in deep
What can we do using ftrace?
—————————–
Debugging Linux Kernel
Analyzing Latencies in Linux Kernel
Learn and observe the flow of Linux Kernel
Trace context switches
Length of the time the interrupts are disabled
And many more
Who this course is for:
Kernel developers interested to learn various debugging techniques


Reviews
There are no reviews yet.